First Contentful Paint (FCP) measures the loading time of elements in a web page and is sometimes confused with First Paint (FP). The difference between the two is that FP measures the time it takes for the very first pixels to load in the browser after a user visits a page, whereas FCP measures the loading time of content useful to the user, such as text or graphics. The two measures would be very close on a fast and simple website reached via a fast internet connection, but they would differ for a complex website reached over a slow network.

For a more formal definition, First Contentful Paint (FCP) is a browser performance metric that measures the time to render the first content of the Document Object Model (DOM) when loading a web page. These DOM elements include images, text, non-white
When FCP is low, the user will instantly see the content when entering the URL and loading the web page. On the other hand, the browser will take a long time to render the first content when the web page has a higher FCP, which the user would perceive as a slow web page.
{{banner-16="/design/banners"}}
How First Contentful Paint Relates to Largest Contentful Paint
FCP and Largest Contentful Paint (LCP) measure the loading of elements onto a web page. LCP measures the time it takes for the largest element (often an image) to appear in the viewport before the user scrolls or clicks on a button.
In contrast, FCP doesn’t differentiate between the sizes of the elements in its measurement and simply measures the time it takes for the browser to load the first DOM element independent of its size, which can be text, image, or SVG.
How First Contentful Paint Affects SEO
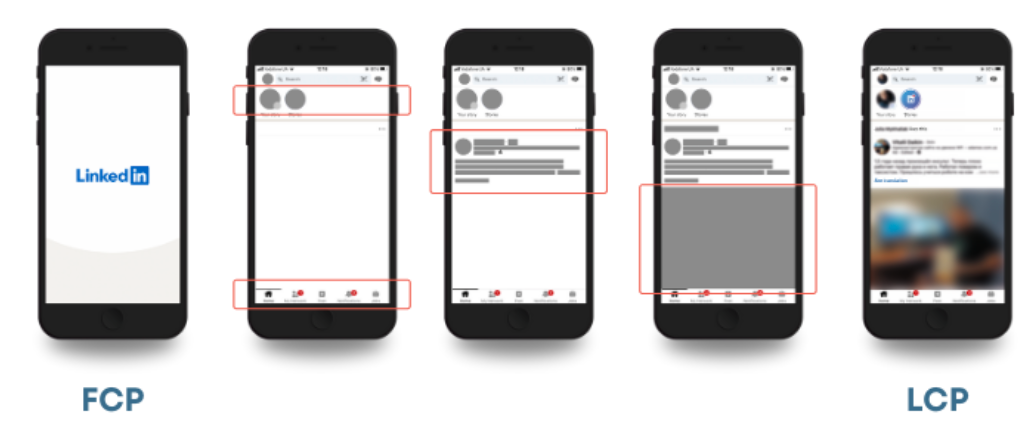
Page speed is an important factor that Google considers when ranking websites for SEO: A website will be ranked highly by search engines if it is fast. FCP is useful for the user because it shows how quickly the page provides visual feedback, even though LCP may be more correlated with the user’s perception of the page speed. For example, the following image shows the difference between FCP and LCP in loading a LinkedIn page.
Although FCP is not a core web vital metric, LCP is a core web vital that can be affected by slower FCP. For example, render-blocking resources like JavaScript and CSS delay FCP, consequently delaying LCP. Furthermore, the page will take more time to reach FCP and, consequently, LCP with larger images.
{{banner-34="/design/banners"}}
The Business Impact of First Contentful Paint: A Case Study
Renault Group is a multinational automobile manufacturer in France with branches in over 130 countries. A case study documented by Google claims that it has improved its website bounce rate and conversion rate by optimizing LCP. In its efforts to improve LCP, it used server-side rendering to improve FCP.
First, Renault used Google Analytics to send all the web vitals metrics from actual users of its single-page application (SPA). The results showed a strong correlation between LCP and bounce and conversion rates.
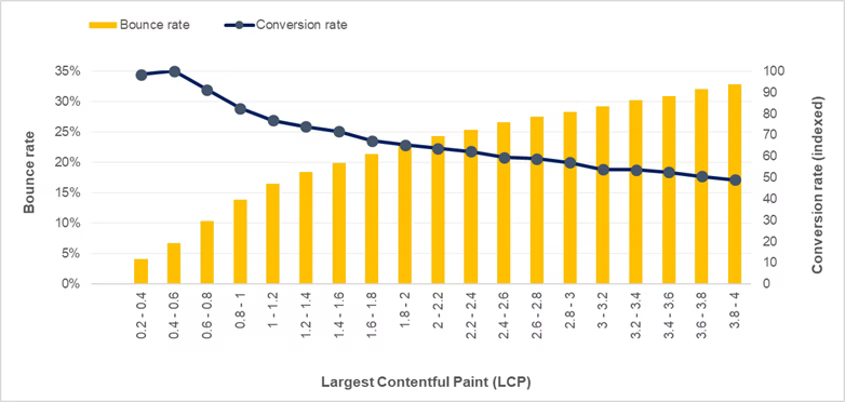
As LCP went up, the bounce rate also increased while the conversion rate became lower. Renault Group identified the need to get LCP under 1 second to improve bounce and conversion rates through this analysis.
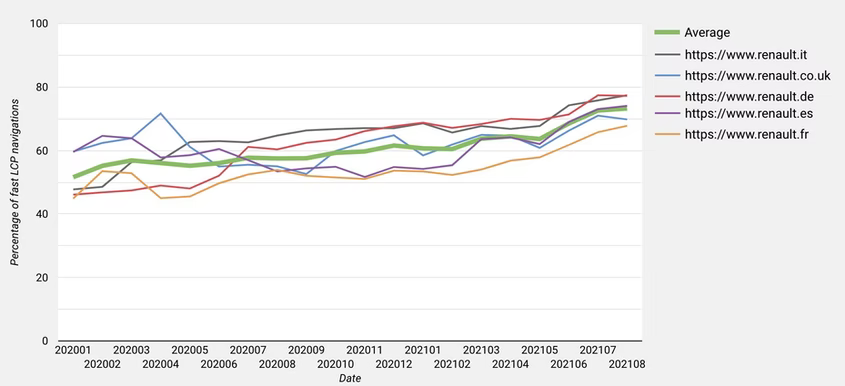
Its teams set up monitoring solutions with Google Lighthouse and Chrome UX Report API to achieve the firm’s target and took several measures to optimize SPA. They added many improvements to optimize their single-page application, including code splitting, lazy loading, and using responsive images. In addition, they did server-side rendering to improve FCP. As a result, they were able to improve “the number of visitors experiencing a fast LCP (under 2.5 s) by an average of 22% for Renault domains (from 51% to 73%).” (Source web.dev)
What Is a Good FCP score?
A good FCP score is generally under 1.8 seconds. The following table shows how the FCP value affects the performance of a web page according to Google Lighthouse.
How to Measure First Contentful Paint
In the following example, we will see how to measure FCP using WebPageTest. You can go through the following steps to run a test on your chosen web page and retrieve core web vitals information:
- Go to https://webpagetest.org/
- Select the web vitals tab from the main page.
- Enter the web page URL you want to test; we used yahoo.com.
- Select the test configuration you want. If you want to test a mobile rendering, select Mobile-4G, otherwise use Desktop-cable.
- Start the test and wait a couple of minutes to get the final results. The WebPageTest will execute three runs of the page load.
- Go to the performance test results page and click on the Web Vitals section.
- Select View as Filmstrip under Largest Contentful Paints to see the page load frame by frame in 0.5 s intervals, or watch the video to see how the user experiences the page load.
The following is the film strip view for yahoo.com:
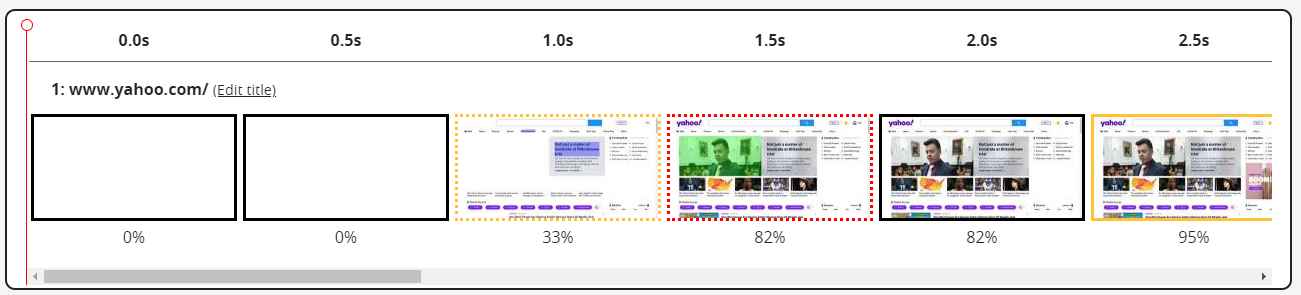
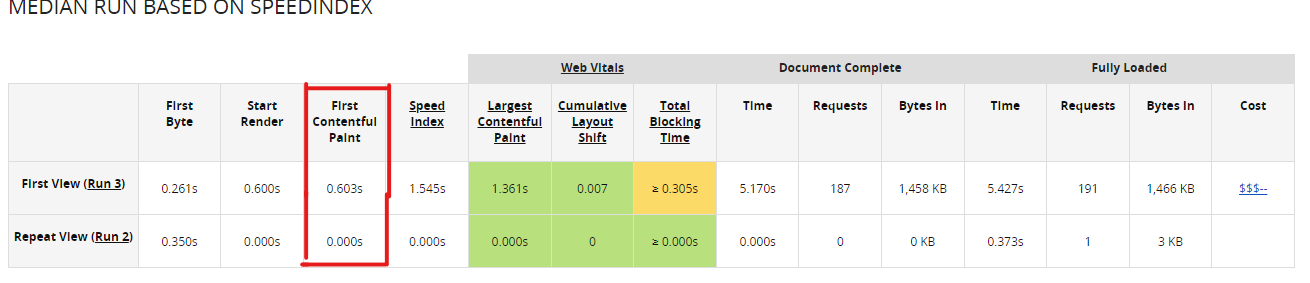
You can find the performance results in the Summary tab. In our example, the FCP is 0.603 s for the third run, which is a very good score. The LCP is 1.361 s, indicating that this page has a good load speed. You can find the test results of the above test conducted on WebPage Test at this link.
Additionally, you can compare the metrics for all three runs by clicking on the Compare all runs button on the filmstrip view page. Then, if you scroll down the page, you can see the timing comparison for all the performance metrics. The following image shows the timing comparisons of our example. According to the graph below, our example web page maintained FCP under 1 second for all three runs.

{{banner-35="/design/banners"}}
What Contributes to Having a Poor First Contentful Paint?
1. Render-Blocking Resources
JavaScript, CSS, and HTML are render-blocking resources that take a great deal of time to load and significantly hinder the full page from rendering. They delay the time to reach FCP, affecting LCP and Time to Interactive (TTI). These blocking resources are often non-critical files that you can load after the browser renders the essential resources. It is important to identify the most critical resources and defer the non-critical ones.
For example, the following image shows the performance metrics of the page https://www.newsfirst.lk/ which you can find here. The FCP is 2.958 seconds, which is very high, and the other core web vitals, such as LCP, CLS, and TBT, are also high.
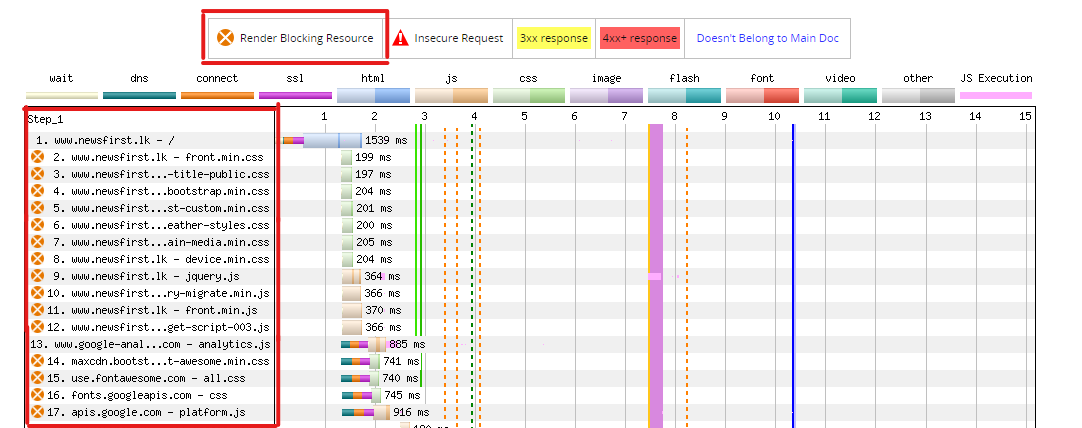
WebPageTest can identify such render-blocking resources, highlighting them using an orange cross mark. Image above shows the render-blocking resources of our example page, indicating that our example page has several render-blocking JS and CSS files.
How to Fix the Problem
The main solution is deferring non-critical JS and CSS code until after you have loaded the most critical resources that are required at the start. Profile your page and identify the blocking elements. Removing non-critical third-party JavaScript and CSS and minifying the scripts can also help mitigate this issue.
{{banner-36="/design/banners"}}
2. Slow Server Response Times
When the browser makes a network request, it will be sent to the server to respond with the page content. The server response time is the time that the server takes to send the response to the browser. In terms of website performance metrics, server response time is the Time to First Byte (TTFB), which is the time for the browser to receive the first byte of the page.
A high TTFB indicates that your server response time is higher, directly affecting the time to achieve FCP. For example, the following image shows that the TTFB is as high as 1.326 s.

How to Fix the Problem
There are several solutions to mitigate this problem:
- Enable content caching for frequently used content like text and images. Caching enables the browser to retrieve content from the cache without loading it from the server every time.
- Use a CDN to deliver static resources like images and videos to reduce the network latency since CDN servers are closer to the client devices.
- Sometimes the server backend logic may be complicated; it may be doing heavy processing before sending a response. In such cases, you can optimize server queries and the backend logic to improve response time.
- Improve the performance of your servers by adding more capacity or more servers.
3. Unused CSS
Web developers usually use external stylesheets and link them to the main HTML page using a tag. While that is convenient for them, it can affect the FCP if they load unused CSS. The browser parses and processes all the CSS files, and it won’t render anything before it processes the CSS because it is required for page styling. These external CSS files will have to be downloaded from the network, which can be affected by network delays. Unused CSS also slows down render tree construction as the browser checks all the CSS to construct it.
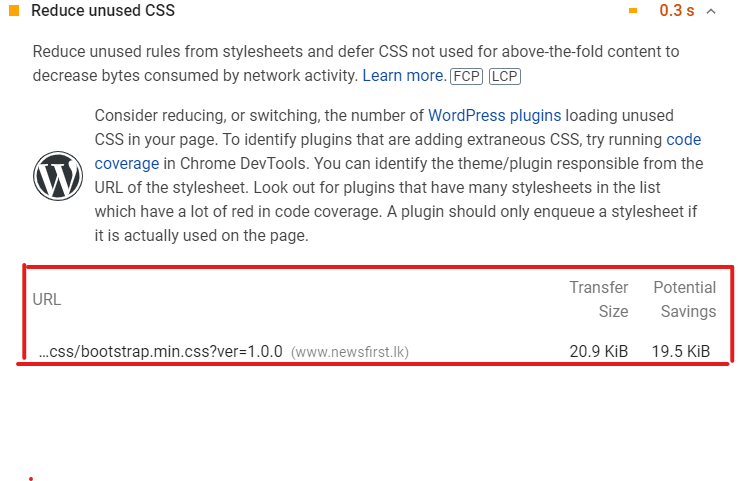
You can find unused CSS by using the PageSpeed Insights tool. The following image shows the unused CSS in our example web page and the potential savings (0.3 s) achievable by optimizing it.
How to Fix the Problem
First, identify the most critical CSS using Chrome Dev Tools, declare this CSS inline, and use the “preload” link to load the rest of the CSS asynchronously. Then the browser does not have to wait until it gets downloaded; it will immediately apply the critical CSS required to render the page.
4. Large Website Images
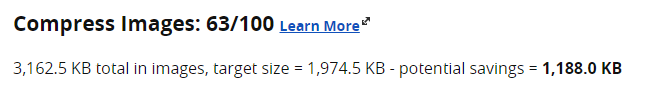
Image files are one of the largest elements of any website that need to be downloaded by the browser before they can be displayed. The larger the image size is, the longer it takes to load the image, thus directly affecting FCP. Poor FCP often happens when large images are not compressed to reduce their size.
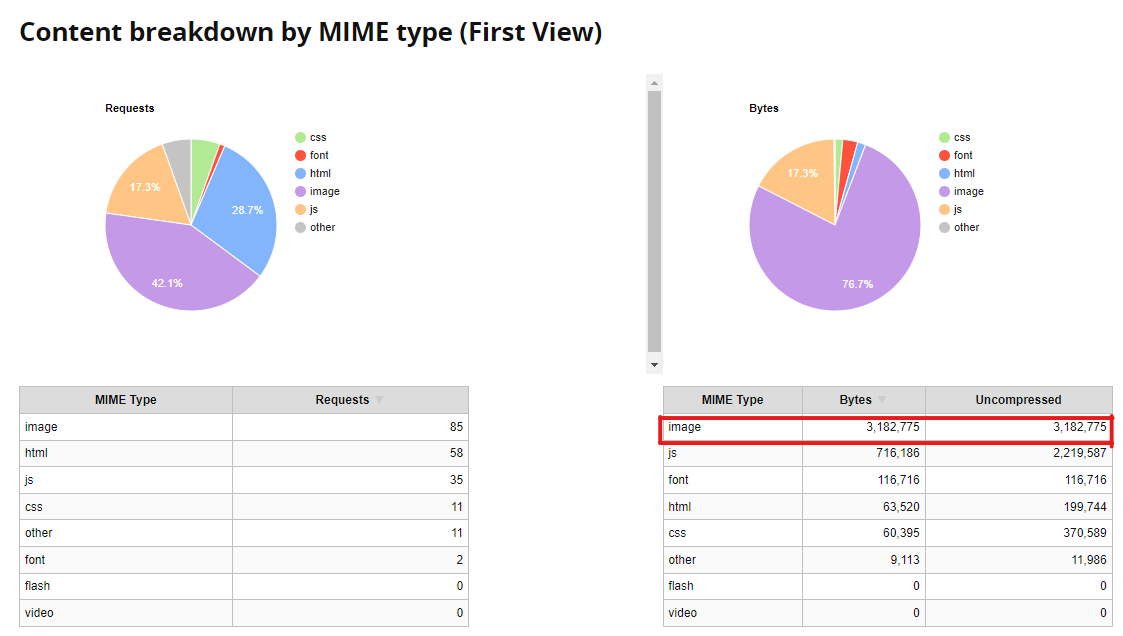
WebPageTest shows the content breakdown by MIME type, indicating the size of uncompressed images. For example, according to image below, there are many image bytes in our example test page, all of which are uncompressed.
It also shows how many bytes you can save by compressing images, as shown below.
How to Fix the Problem
The simplest solution to this problem is to compress large, high-resolution images. Compressing an image will not change its dimensions, just decrease the image file size by decreasing the amount of data it contains. The browser can then download the compressed images within a less amount of time. However, JPEG images are already compressed. Thus, it will not work with JPEG images.
Another option is to leverage an image content delivery network (CDN) that enables browsers to retrieve images faster. An image CDN also enables image resizing and compression to decrease image payload, optimizing it for each requesting device in real time.
{{banner-37="/design/banners"}}
5. Excessive DOM Size
If your page has a large DOM tree, it requires significant computing power to render the page. Having a large DOM tree means there are many invisible DOM nodes that users cannot see in the initial page load. Moreover, a large DOM tree requires more processing time to compute its styles, increasing memory usage and thus directly increasing the FCP value.
PageSpeed Insights indicates whether the web page has a large DOM size. Image below shows how it indicates the DOM size of the page https://www.bbc.com/news/world.

How to Fix the Problem
- Use pagination when there are repeated elements, like a list of products, posts, comments, etc.
- Using lazy loading to load HTML elements.
- Split the webpage into multiple small pages.
Summing Up
FCP is an essential website performance metric that indicates the time it takes for a web page to render the first content of the DOM. Although not a core web vital, it directly affects the core web vitals like LCP, which determines the SEO ranking of a web page. Several factors contribute to having poor FCP, such as render-blocking resources, unused CSS, uncompressed images, and slow server response time. Web developers can improve FCP and other core web vitals by following the solutions discussed in this article.

